A post after a very long time. This year i presented in Sangam12 , AIOUG's Annual Conference held in Bangalore in Nov 2 and 3rd. My presentation is about how to use profiling tools to profile PLSQL codes. Presentation went well though this was the first time i spoke for about an hour. Last year when i attended Sangam 11, i kept a goal for myself to present in such a conference. Goal achieved :)
12/23/2012
10/11/2012
A new book on Performance tuning
Though the scope for performance tuning is limited in my current assignment, i am inquisitive about what performance tuning is and how as a developer i can write efficient programs, queries. I recently bought Oracle Database performance tuning tips and Techniques book by Richard Niemiec. I was lucky to attend a session on Introduction to Exadata by Rich Niemiec, Thanks to AIOUG for bringing him to bangalore last year for Sangam 11.
The presentation itself was very informative. His presentation style was awesome and as stylish as Rajnikanth. The man inspired me. So enhance my performance tuning knowledge, as a starting place would be none other than Rich's updated version of performance tuning book. Flipkart delivered the book on monday. Here is the newest collection to my books.

This is gonna keep me busy.
Regards,
Vijay
9/26/2012
Hierarchical Profiler - DBMS_HPROF
Dbms_hprof package
reports dynamic execution profile of the plsql program organised by subprogram
calls. This seperately accounts plsql and sql calls. Also provides subprogram
level execution summary. It has two components - data collection and analyzer. Data collection has apis to turn hierarchical
profiling on and off. It produces raw profiler output. Analyzer processes raw
profiler output and store the data to database tables. Hierarchical profiler is
aided by plshprof utility which takes the raw profiler output as input and
creates html reports.
Initial setup:
By default dbms_hprof is installed in oracle 11g.
One can check if it is installed by running
Desc dbms_hprof
If it is not installed, run the script dbmshptab.sql (inside rdbms/admin folder in oracle home
path) in the schema one need to profile the units.
conn user/password
@/home/oracle/app/oracle/product/11.2.0/dbhome_2/rdbms/admin/dbmshptab.sql
This script will create three tables :
-
dbmshp_function_info
-
dbmshp_parent_child_info
-
dbmshp_runs
To do hierarchical profiling using dbms_hprof, the
schema need to have execute privilege on DBMS_HPROF package and write access to
a directory object referred in start_profiling procedure.
Eg: Giving access to HR schema:
GRANT EXECUTE ON dbms_hprof TO HR;
CREATE DIRECTORY PLSQL_HPROF
AS '/home/oracle/plsql_hprof';
GRANT ALL ON DIRECTORY
PLSQL_HPROF TO HR;
Process of Hierarchical profiling involves starting
the profiler, executing plsql program code and
stopping profiler. To start profiler, dbms_hprof offers start_profiling
procedure. To stop stop_profiling procedure is used.
Example
Create or replace procedure
hprof1 is
Begin
Calc_days(sysdate - 1000);
End;
begin
dbms_hprof.start_profiling(
location => 'PLSQL_HPROF', filename=>'Run1.trc');
hprof1;
dbms_hprof.stop_profiling;
end;
This will generate raw profiler data in file
Run1.trc in the directory referred by PLSQL_HPROF directory object. Raw
profiler output is like:
P#V
PLSHPROF Internal Version 1.0
P#!
PL/SQL Timer Started
P#C
PLSQL."HR"."CALC_DAYS"::7."CALC_DAYS"#c0e1380d4054eb50
#1
P#X
191
P#C
PLSQL."SYS"."DBMS_OUTPUT"::11."PUT_LINE"#5892e4d73b579470
#109
P#X
2
P#R
P#X
6
P#C
PLSQL."SYS"."DBMS_OUTPUT"::11."PUT_LINE"#5892e4d73b579470
#109
P#X
1
P#R
P#X
5
P#C
PLSQL."SYS"."DBMS_OUTPUT"::11."PUT_LINE"#5892e4d73b579470
#109
P#X
1
Since the raw profiler data is hard to decipher, one
needs to analyze it using analyze function. It takes trace file location and
name as input and returns runid. It writes the profiled data into the database
tables.
Example:
declare
runid number;
begin
runid := dbms_hprof.analyze(location=>
'PLSQL_HPROF' , filename=> 'Run1.trc');
dbms_output.put_line(' Run ID = ' ||runid);
end;
One can query the database tables for finding
information on profiling data using below queries:
Below sql gives runid:
SELECT runid, run_timestamp,total_elapsed_time,run_comment
FROM dbmshp_runs ORDER BY runid;
From below sql we can find symbolid of
our top level procedure call.
SELECT symbolid, owner,
module, type, function FROM
dbmshp_function_info WHERE runid
= 1 ORDER BY symbolid;
Using symbolid, we can get the hierarchical information
using below:
SELECT RPAD(' ', level*2, '
') || fi.owner || '.' || fi.module AS name, fi.function,
pci.subtree_elapsed_time, pci.function_elapsed_time, pci.calls FROM dbmshp_parent_child_info pci JOIN dbmshp_function_info fi ON pci.runid =
fi.runid AND pci.childsymid = fi.symbolid
WHERE pci.runid = 1
CONNECT BY PRIOR childsymid
= parentsymid
START WITH pci.parentsymid =
2;
PLSHPROF utility:
plshprof utility takes a trace file and generates
various HTML reports.
Example:
$plshprof
-output run1 run1.trc
This generates a set of files with name starting
with run1. Also one can generate difference between two runs of hierarchical
profiling by supplying raw profiler outputs to plshprof utility.
Example:
$plshprof –output
diff <Trace_file1> <Trace_File2>
Reference
- Oracle 11g Advanced application developers guide
- Oracle 11g PLSQL packages and types reference.
- Www.oracle-base.com
9/20/2012
Dbms_Trace
DBMS_TRACE helps to start and stop plsql tracing in
a session.
Steps involved are:
1.
Start
tracing using dbms_trace.set_plsql_trace procedure
2.
Execute
application code to be traced
3.
Stop
plsql tracing using dbms_trace.clear_plsql_trace procedure
Before doing this, one need to do the initial setup
of creating the database tables, using which we can analyze the trace data.
tracetab.sql file creates the database tables required to run dbms_trace. This
file can be found in rdbms/admin folder in oracle home path:
sqlplus /nolog
conn
sys/password as sysdba
@/home/oracle/app/oracle/product/11.2.0/dbhome_2/rdbms/admin/tracetab.sql
This script create 2 tables and a sequence:
1.
plsql_trace_runs
2.
plsql_trace_events
3.
plsql_trace_runnumber
To complete the initial setup, grant access to
public or the user in which one needs to trace the units:
CREATE PUBLIC
SYNONYM plsql_trace_runs FOR plsql_trace_runs;
CREATE PUBLIC
SYNONYM plsql_trace_events FOR plsql_trace_events;
CREATE PUBLIC
SYNONYM plsql_trace_runnumber FOR plsql_trace_runnumber;
GRANT SELECT,
INSERT, UPDATE, DELETE ON plsql_trace_runs TO PUBLIC;
GRANT SELECT,
INSERT, UPDATE, DELETE ON plsql_trace_events TO PUBLIC;
Let’s explore how to use dbms_trace with the help of
an example:
Procedure calc_days takes a date as input parameter
and returns number of days between this date and current date, along with
number of months and years.
Calc_days.sql:
create or
replace procedure calc_days (v_date in date)
is
l_num_days
number;
begin
l_num_days :=
trunc(sysdate- v_date );
dbms_output.put_line('Number
of days :' || l_num_days);
dbms_output.put_line('Number
of months :' || l_num_days *12/365) ;
dbms_output.put_line('Number
of years : ' || l_num_days /365);
end;
Now to make this procedure to be trace enabled,
there are two ways:
1. set the session to trace enabled and create the
procedure
alter session
set set plsql_debug=TRUE;
@calc_days.sql
2. Alter and set debug for the procedure as below:
alter
procedure calc_days compile debug;
Now, we can run the procedure and trace its
execution. To do this the sets to follow is as mentioned above. First we need
to start tracing session by calling dbms_trace.set_plsql_trace.
Set_plsql_trace procedure enables tracing in a
session. It takes trace_level as input. There are various constants which can
be passed for this procedure viz: trace_all_calls, trace_enabled_calls, trace_all_lines,
trace_enabled_lines, trace_all_sql, trace_enabled_sql etc.
After calling set_plsql_trace, one need to run the
application code to be traced after which tracing can be stopped by calling
clear_plsql_trace procedure.
Example usage:
begin
dbms_trace.set_plsql_trace
(dbms_trace.trace_all_lines);
dbms_output.put_line
('Trace started');
calc_days(sysdate-10000);
dbms_output.put_line('To
stop trace');
dbms_trace.clear_plsql_trace;
dbms_trace.set_plsql_trace
(dbms_trace.trace_enabled_lines);
dbms_output.put_line
('Trace started');
calc_days(sysdate-10000);
dbms_output.put_line('To
stop trace');
dbms_trace.clear_plsql_trace;
end;
To analyze trace information, one need to take
run_id of each run which can be found from below query:
select
runid, run_owner , run_date from plsql_trace_runs order by runid;
Query
the table plsql_trace_events table to find the difference among the two traces
SELECT
e.runid,e.event_seq,TO_CHAR(e.event_time, 'DD-MON-YYYY HH24:MI:SS') AS
event_time,e.event_unit_owner,e.event_unit,e.event_unit_kind,e.proc_line,e.event_comment
FROM plsql_trace_events e WHERE e.runid = 1 ORDER BY e.runid, e.event_seq;
Tracing can be done for various levels -
ü for
all calls or only for enabled calls,
ü for
all exceptions or only for enabled exceptions
ü for
all sqls or for enabled sql
ü for
all lines or only for enabled lines.
Controlling Trace:
One can control the trace by pausing the trace when
unwanted in a process execution and resume it when needed. This can be achieved
by passing constants TRACE_PAUSE and TRACE_RESUME.
Reference:
1. Oracle 11g Advanced application developers guide
2. Oracle 11g PLSQL Packages and types reference
3. www.oracle-base.com
Regards,
Vijay
9/06/2012
Get_dependency
Dbms_utility provides a procedure to find various objects dependent on a particular object. This package has a procedure, get_dependency, which uses dbms_output procedure to print the list of objects which are dependent on the given object.
Syntax is:
 DBMS_UTILITY.GET_DEPENDENCY
 type IN VARCHAR2,
 schema IN VARCHAR2,
name IN VARCHAR2); set serveroutput on;
BEGIN
dbms_utility.get_dependency('TABLE','HR','EMPLOYEES');
END; DEPENDENCIES ON HR.EMPLOYEES
------------------------------------------------------------------
*TABLE HR.EMPLOYEES()
* VIEW HR.EMP_DETAILS_VIEW()
* TRIGGER HR.SECURE_EMPLOYEES()
* TRIGGER HR.UPDATE_JOB_HISTORY()
* PROCEDURE HR.ANNUAL_SALARY()
Vijay
9/05/2012
Bulk Compilation of Invalid Objects
Compile_Schema procedure in dbms_utility package can be used to compile all the objects in a schema or only the invalid objects in a schema.
Syntax is:
 DBMS_UTILITY.COMPILE_SCHEMA (
 schema IN VARCHAR2,
 compile_all IN BOOLEAN DEFAULT TRUE,
 reuse_settings IN BOOLEAN DEFAULT FALSE);
Example usage:
This is an example usage to compile all invalid objects in HR schema:
 BEGIN
 DBMS_UTILITY.COMPILE_SCHEMA('HR',FALSE,TRUE);
 END;
Regards,
Vijay
9/03/2012
DBMS_PROFILER
DBMS_PROFILER package, introduced in Oracle8i, provides a means to collect profiling data of plsql program units for performance improvement.
To use dbms_profiler package, we need to create the database tables which will store the profiler data. These tables can be created by running proftab.sql script which will be present in /rdbms/admin folder in the oracle installation folder.
This script creates:
- A sequence plsql_profiler_runnumber
- table plsql_profiler_data
- plsql_profiler_units
- plsql_profiler_runs
Lets do the initial setup:
1: CONN SYS/PASSWORD AS SYSDBA
2: @/home/oracle/app/oracle/product/11.2.0/dbhome_2/rdbms/admin/proftab.sql
3: CREATE PUBLIC SYNONYM plsql_profiler_runs FOR plsql_profiler_runs;
4: CREATE PUBLIC SYNONYM plsql_profiler_units FOR plsql_profiler_units;
5: CREATE PUBLIC SYNONYM plsql_profiler_data FOR plsql_profiler_data;
6: CREATE PUBLIC SYNONYM plsql_profiler_runnumber FOR plsql_profiler_runnumber;
7: GRANT SELECT ON plsql_profiler_runnumber TO PUBLIC;
8: GRANT SELECT, INSERT, UPDATE, DELETE ON plsql_profiler_data TO PUBLIC;
9: GRANT SELECT, INSERT, UPDATE, DELETE ON plsql_profiler_units TO PUBLIC;
10: GRANT SELECT, INSERT, UPDATE, DELETE ON plsql_profiler_runs TO PUBLIC;
The sets involved in profiling a plsql unit using dbms_profiling is:
- Start the profiling session using dbms_profiler.start_profiling
- Run the plsql unit to be profiled
- Stop the profiling session
- After this query the profiler tables we created earlier to check for which subprograms or line took maximum time to execute. Analyze why it took this long and modify as appropriate.
An Example:
1: create or replace procedure annual_salary
2: as
3: l_annual_salary NUMBER; 4: begin
5: for i in ( select employee_id, salary from employees)
6: loop 7: l_annual_salary := i.salary * 12; 8: end loop;
9: end annual_salary;
10: /11: DECLARE
12: l_result BINARY_INTEGER; 13: BEGIN
14: l_result := DBMS_PROFILER.start_profiler(run_comment => 'annual_salary' );
15: annual_salary; 16: l_result := DBMS_PROFILER.stop_profiler; 17: END;
18: / Run this query
SELECT runid, run_date, run_comment, run_total_time FROM plsql_profiler_runs where run_comment = 'annual_salary'
ORDER BY runid;
This gave below output:
RUNID RUN_DATE RUN_COMMENT RUN_TOTAL_TIME
------ --------- -------------------------------------------------- --------------
4 02-SEP-12 annual_salary 50000000
------ --------- -------------------------------------------------- --------------
4 02-SEP-12 annual_salary 50000000
To analyze which subprogram or line in the plsql unit profiled took how much time :
SELECT u.runid, u.unit_number, u.unit_type, u.unit_owner, u.unit_name, d.line#, d.total_occur,d.total_time, d.min_time, d.max_time
FROM plsql_profiler_units u JOIN plsql_profiler_data d ON u.runid = d.runid
AND u.unit_number = d.unit_numberWHERE u.runid = 4 ORDER BY u.unit_number, d.line#;
This produces below output:
RUNID UNIT_NUMBER UNIT_TYPE UNIT_OWNER UNIT_NAME LINE# TOTAL_OCCUR TOTAL_TIME MIN_TIME MAX_TIME
------ ----------- -------------------- -------------- --------------- ---------- ----------- ---------- ---------- ----------
4 1 ANONYMOUS BLOCK <anonymous> <anonymous> 1 0 0 0 0
4 1 ANONYMOUS BLOCK <anonymous> <anonymous> 3 0 0 0 0
4 1 ANONYMOUS BLOCK <anonymous> <anonymous> 4 0 233173 233173 233173
4 1 ANONYMOUS BLOCK <anonymous> <anonymous> 5 2 82399 10519 71880
4 1 ANONYMOUS BLOCK <anonymous> <anonymous> 6 1 14025 14025 14025
4 1 ANONYMOUS BLOCK <anonymous> <anonymous> 7 0 0 0 0
4 2 PROCEDURE HR ANNUAL_SALARY 1 1 29804 8765 21038
4 2 PROCEDURE HR ANNUAL_SALARY 4 1 0 0 0
4 2 PROCEDURE HR ANNUAL_SALARY 6 109 16819193 7012 675853
4 2 PROCEDURE HR ANNUAL_SALARY 8 107 1495468 8765 120969
4 2 PROCEDURE HR ANNUAL_SALARY 9 1 0 0 0
RUNID UNIT_NUMBER UNIT_TYPE UNIT_OWNER UNIT_NAME LINE# TOTAL_OCCUR TOTAL_TIME MIN_TIME MAX_TIME
------ ----------- -------------------- -------------- --------------- ---------- ----------- ---------- ---------- ----------
4 2 PROCEDURE HR ANNUAL_SALARY 10 1 15778 15778 15778
12 rows selected.
------ ----------- -------------------- -------------- --------------- ---------- ----------- ---------- ---------- ----------
4 1 ANONYMOUS BLOCK <anonymous> <anonymous> 1 0 0 0 0
4 1 ANONYMOUS BLOCK <anonymous> <anonymous> 3 0 0 0 0
4 1 ANONYMOUS BLOCK <anonymous> <anonymous> 4 0 233173 233173 233173
4 1 ANONYMOUS BLOCK <anonymous> <anonymous> 5 2 82399 10519 71880
4 1 ANONYMOUS BLOCK <anonymous> <anonymous> 6 1 14025 14025 14025
4 1 ANONYMOUS BLOCK <anonymous> <anonymous> 7 0 0 0 0
4 2 PROCEDURE HR ANNUAL_SALARY 1 1 29804 8765 21038
4 2 PROCEDURE HR ANNUAL_SALARY 4 1 0 0 0
4 2 PROCEDURE HR ANNUAL_SALARY 6 109 16819193 7012 675853
4 2 PROCEDURE HR ANNUAL_SALARY 8 107 1495468 8765 120969
4 2 PROCEDURE HR ANNUAL_SALARY 9 1 0 0 0
RUNID UNIT_NUMBER UNIT_TYPE UNIT_OWNER UNIT_NAME LINE# TOTAL_OCCUR TOTAL_TIME MIN_TIME MAX_TIME
------ ----------- -------------------- -------------- --------------- ---------- ----------- ---------- ---------- ----------
4 2 PROCEDURE HR ANNUAL_SALARY 10 1 15778 15778 15778
12 rows selected.
The lines 6 and 8 has taken maximun time.
Using dbms_profiler, one can tune their plsql units iteratively.
Regards,
Vijay
8/04/2012
Logging Errors using Error back trace and Error Stack functions
From 10g version, Oracle database provides a mechanism to log
exceptions in the form of two functions in DBMS_UTILITY package viz., FORMAT_ERROR_STACK and FORMAT_ERROR_BACKTRACE.
FORMAT_ERROR_BACKTRACE function return the error stack along
the place where exception occurred where
as FORMAT_ERROR_STACK just returns the
error stack.
Syntax of these two functions is :
DBMS_UTILITY.FORMAT_ERROR_BACKTRACE
RETURN VARCHAR2;
DBMS_UTILITY.FORMAT_ERROR_STACK
RETURN VARCHAR2;
Example:
Create or replace procedure proc0 is
Begin
RAISE NO_DATA_FOUND;
END;

CREATE OR REPLACE PROCEDURE PROC1 IS
BEGIN
PROC0();
END;
CREATE OR REPLACE PROCEDURE PROC2 IS
BEGIN
PROC1();
END;
CREATE OR REPLACE PROCEDURE PROC3 IS
BEGIN
PROC2();
END;

CREATE OR REPLACE PROCEDURE PROC4 IS
BEGIN
PROC3();
END;
/*CALL WITHOUT ERROR BACK TRACE*/
BEGIN
PROC4();
END;
Output of this when I ran in Oracle
11gR2 HR schema:
Error report:
ORA-01403: no data found
ORA-06512: at "HR.PROC0", line 3
ORA-06512: at "HR.PROC1", line 3
ORA-06512: at "HR.PROC2", line 3
ORA-06512: at "HR.PROC3", line 3
ORA-06512: at "HR.PROC4", line 3
ORA-06512: at line 2
01403. 00000 -  "no data found"
*Cause:
*Action:
/*CALL WITH ERROR BACK TRACE*/
SET SERVEROUTPUT ON;
BEGIN
PROC4();
EXCEPTION
WHEN OTHERS THEN
DBMS_OUTPUT.PUT_LINE(‘-------------------------------------------’);
DBMS_OUTPUT.PUT_LINE(DBMS_UTILITY.FORMAT_ERROR_STACK);
DBMS_OUTPUT.PUT_LINE(DBMS_UTILITY.FORMAT_ERROR_BACKTRACE);
DBMS_OUTPUT.PUT_LINE(‘-------------------------------------------’);
END;

anonymous block completed
-------------------------------------------
ORA-01403: no data found

ORA-06512: at "HR.PROC0", line 3
ORA-06512: at "HR.PROC1", line 3
ORA-06512: at "HR.PROC2", line 3
ORA-06512: at "HR.PROC3", line 3
ORA-06512: at "HR.PROC4", line 3
ORA-06512: at line 2
-------------------------------------------
These functions especially FORMAT_ERROR_BACKTRACE comes
handy when your program unit calls a lot of functions and procedures and you
capture any unhandled exception in when other section – to ensure where this
unhandled exception occurred.
Cheers,
Vijay
Cheers,
Vijay
7/25/2012
Passwords in SQL Developer
For those people who hate to type in the passwords when you login to oracle database using sql developer, you can check the Save Password option when you create a connection as shown :

But there are some set of people who think saving the password is not the right thing to do. So if you are one among them, you can disable this feature by removing the Save Password Option by adding below text to sqldeveloper.conf file in SQLDEVELOPERBIN folder
AddVMOption -Dsqldev.savepasswd=false
Regards,
Vijay
7/23/2012
Display Line number in SQL Developer
If you want to enable displaying line numbers in sql developer's code editor, you can enable this option in preference. Go to Tools --> Preference --> Code Editor --> Line Gutter and check the Show line number option as shown below:

I am sure this will save you considerable amount of time while debugging the code.
I am sure this will save you considerable amount of time while debugging the code.
7/18/2012
SQL Developer - Formatting SQL
Formatting sqls in sql developer is very simple if you know the shortcut - Ctrl + Shift +F7.
Once you have the sql to be formatted in worksheet ( for eg., as in below pic)
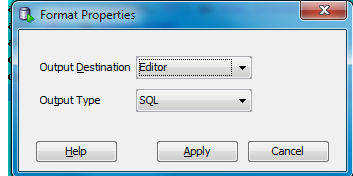
Press the keys Ctrl + Shift + F7 together, Format properties dialog box as below would appear.
 Once you click Apply button, the sql gets formatted as shown below:

Once you have the sql to be formatted in worksheet ( for eg., as in below pic)
 |
| Sql before formatting |
Press the keys Ctrl + Shift + F7 together, Format properties dialog box as below would appear.
7/16/2012
SQL Developer - Setting NLS
In SQL developer, NLS settings like date format, timestamp format, currency etc.,can be set in NLS option in Preference --> Database.
NLS options look like below screenshot:
NLS options look like below screenshot:
 |
| Preference - database - NLS |
7/13/2012
SQL Developer Tip - 2 Colourful Girds in Table Data
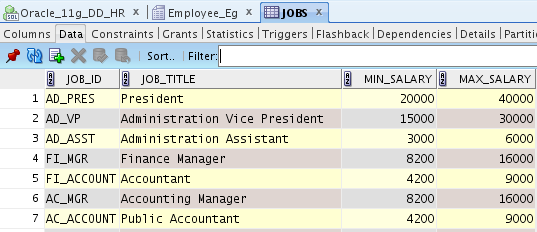
If you want to display the result set of a query or table data in colourful grids, instead of a mundane white colour background as shown below:
To the one shown below with Zebra like pattern of colours:
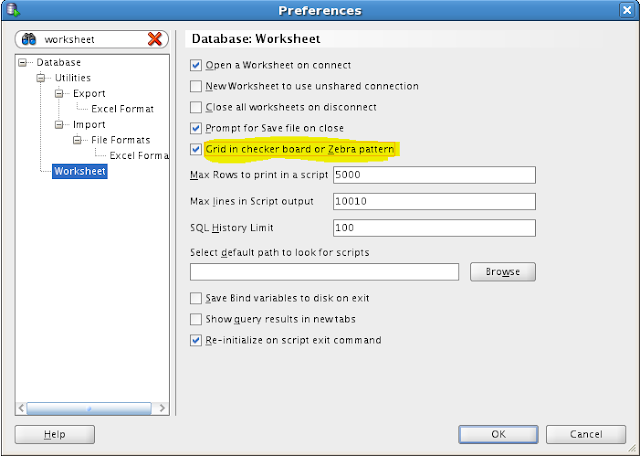
This can be done by selecting the preference - Tools --> Preference --> Database --> Worksheet --> Grid in Checker board or Zebra Pattern
Now you can see your resultset of sql would look colourful
 | |||||
| Jobs Table Data without Grid pattern |
 |
| Add caption |

Now you can see your resultset of sql would look colourful
7/12/2012
SQL Developer Tips
Inspired by Jeff Smith's post on SQL Developer, the tools which i am using for over two years
I have decided to blog on the same lines as Jeff - about the tricks and tricks which can save time for the developers when using SQL Developer.
Today's Tips is about the short cut keys to open the Object details / source codes of any objects like Procedures or any functions
If yo are int eh middle of coding and you want to see the source code of a procedure you use. Simply select the procedure and Press Shift + F4 . The source code will open in a seperate window. For example, I have selected ADD_JOB_HISTORY procedure and upon pressing Shift + F4 keys the source code opens up.

Source code of this Procedure opens up as :

4/14/2012
Installing Oracle XE
This one is for anyone who wants to start learning Oracle database and looking for a personal edition of Oracle db.
Oracle offers a free database verion called Oracle XE ( with a term of condition that it need to be used for educative purposes and a few limitations as well). One can download it from www.oracle.com
An installation guide was posted by Scott Wesley.
You can install this oracle express edition and play around your own db.
Cheers
Vijay
3/29/2012
File Handling for Beginners
In this article, we will deal about file handling in PLSQL. This article will give a brief idea about file handling for rookie developers. To read or write any files stored in the operating system, the user need to have read or write permission for the directory. Prior to that, to access a file we need to supply the destination folder of the file as well as the name of the file.
There are two ways to specify the directory location of the file. First this can be mentioned against UTL_FILE_DIR parameter in the database initialisation file.Secondly one can create a directory object and use this object reference. This approach is introduced in Oracle 9i and is recommended to use.
<DIRECTORY_NAME> is the name of directory object. EG: UTLTEST
<DESTINATION FOLDER> is the name of the folder in the operating system
eg: /home/oracle/utltest
Let me create a test directory:
Once a directory is created, our schema user(HR in below examples) need read write permission granted. SYS DBA need to assign these privilege:
Output:
Contents of the previously created file are displayed on the screen. Only a part of the output is shown below.
There are two ways to specify the directory location of the file. First this can be mentioned against UTL_FILE_DIR parameter in the database initialisation file.Secondly one can create a directory object and use this object reference. This approach is introduced in Oracle 9i and is recommended to use.
Creation of Directory:
Directory is owned by SYS account. Only a user with Create any directory privilege can create a directory. Syntax to create it is:
CREATE DIRECTORY <DIRECTORY_NAME> AS <DESTINATION FOLDER>
<DIRECTORY_NAME> is the name of directory object. EG: UTLTEST
<DESTINATION FOLDER> is the name of the folder in the operating system
eg: /home/oracle/utltest
Let me create a test directory:
 CONN SYS/<password> as SYSDBA
 CREATE DIRECTORY UTLTEST AS '/home/oracle/utltest';
 -- NOTE this directory path is applicable to unix environment
Once a directory is created, our schema user(HR in below examples) need read write permission granted. SYS DBA need to assign these privilege:
GRANT READ, WRITE ON DIRECTORY UTLTEST TO HR;
Opening a file:
Before we can read or write into a file we must open it. UTL_FILE function allows us to open a file in three mode Read , Write and append mode. This function returns a file handler of type FILE_TYPE in UTL_FILE package. It takes parameters file location, file name and mode to open the file. The file location parameter should represent a valid directory name. Combination of file location and file name need to give the full path of the file. As far as file mode is concerned, use 'R' for Read mode, 'W' for write mode and 'A' for append mode where we can read and write the file. For Read and Append mode the file must exist when we try to open the file.Writing to a file:
To write to a file, we have UTL_FILE programs like PUT, PUT_LINE, NEW_LINE, PUTF and FFLUSH are available. In the example below PUT_LINE procedure is used.
Reading from a file:
GET_LINE procedure helps us to read from a file. In the second example, this procedure is used. This procedure takes file handle as in parameter and a VARCHAR2 parameter to return the line read from the file. This out parameter need to be large enough to accomodate the whole line read else VALUE_ERROR exception While reading from a file using GET_LINE inside a loop, if the pointer goes beyond the end of file, NO_DATA_FOUND exception is raised. So care needs to be taken to handle this.
Example 1: Writing into a file:
Below is an example code of writing into a CSV file. Run this by connecting as HR user
 DECLARE
 FH UTL_FILE.FILE_TYPE;
 L_STRING VARCHAR2(1000);
 BEGIN
 FH := UTL_FILE.FOPEN('UTLTEST','EMPLOYEES' || TO_CHAR(SYSDATE,'DDMMYYHHMISS') || '.CSV','W');
 FOR EMP_CUR IN (SELECT * FROM EMPLOYEES)
 LOOP
 --L_STRING VARCHAR2(1000);
 L_STRING := EMP_CUR.EMPLOYEE_ID || ','
          || EMP_CUR.FIRST_NAME || ','
          || EMP_CUR.LAST_NAME || ','
          || EMP_CUR.EMAIL || ','
          || EMP_CUR.PHONE_NUMBER || ','
          || EMP_CUR.HIRE_DATE || ','
          || EMP_CUR.JOB_ID || ','
          || EMP_CUR.SALARY || ','
          || EMP_CUR.COMMISSION_PCT || ','
          || EMP_CUR.MANAGER_ID || ','
          || EMP_CUR.DEPARTMENT_ID;
 UTL_FILE.PUT_LINE(FH,L_STRING);
 END LOOP;
 UTL_FILE.FCLOSE(FH);
 END;
Output:
PL/SQL procedure successfully completed.
Example 2: Reading from a file:
Run this by connecting as HR user. In this example we read the previously created file and print it in screen
 DECLARE
 FH UTL_FILE.FILE_TYPE;
 L_LINE VARCHAR2(32767);
 BEGIN
 FH := UTL_FILE.FOPEN('UTLTEST','EMPLOYEES290312075110.CSV','R');
 LOOP
 UTL_FILE.GET_LINE(FH,L_LINE);
 DBMS_OUTPUT.PUT_LINE(L_LINE);
 END LOOP;
 EXCEPTION
 WHEN NO_DATA_FOUND THEN
  UTL_FILE.FCLOSE(FH);
 END;
Contents of the previously created file are displayed on the screen. Only a part of the output is shown below.
 200,Jennifer,Whalen,JWHALEN,515.123.4444,17-SEP-87,AD_ASST,4400,,101,10
 201,Michael,Hartstein,MHARTSTE,515.123.5555,17-FEB-96,MK_MAN,13000,,100,20
 202,Pat,Fay,PFAY,603.123.6666,17-AUG-97,MK_REP,6000,,201,20
 203,Susan,Mavris,SMAVRIS,515.123.7777,07-JUN-94,HR_REP,6500,,101,40
 204,Hermann,Baer,HBAER,515.123.8888,07-JUN-94,PR_REP,10000,,101,70
 205,Shelley,Higgins,SHIGGINS,515.123.8080,07-JUN-94,AC_MGR,12000,,101,110
 206,William,Gietz,WGIETZ,515.123.8181,07-JUN-94,AC_ACCOUNT,8300,,205,110
There are various other methods like FCOPY, FREMOVE, FRENAME, FGETATTR which allows us to manipulate files. More information on these can be found here
Reference :
Cleanup scripts:
 CONN SYS/<password> as sysdba
 DROP DIRECTORY UTLTEST;
Cheers,
Vijay
Subscribe to:
Posts
(
Atom
)